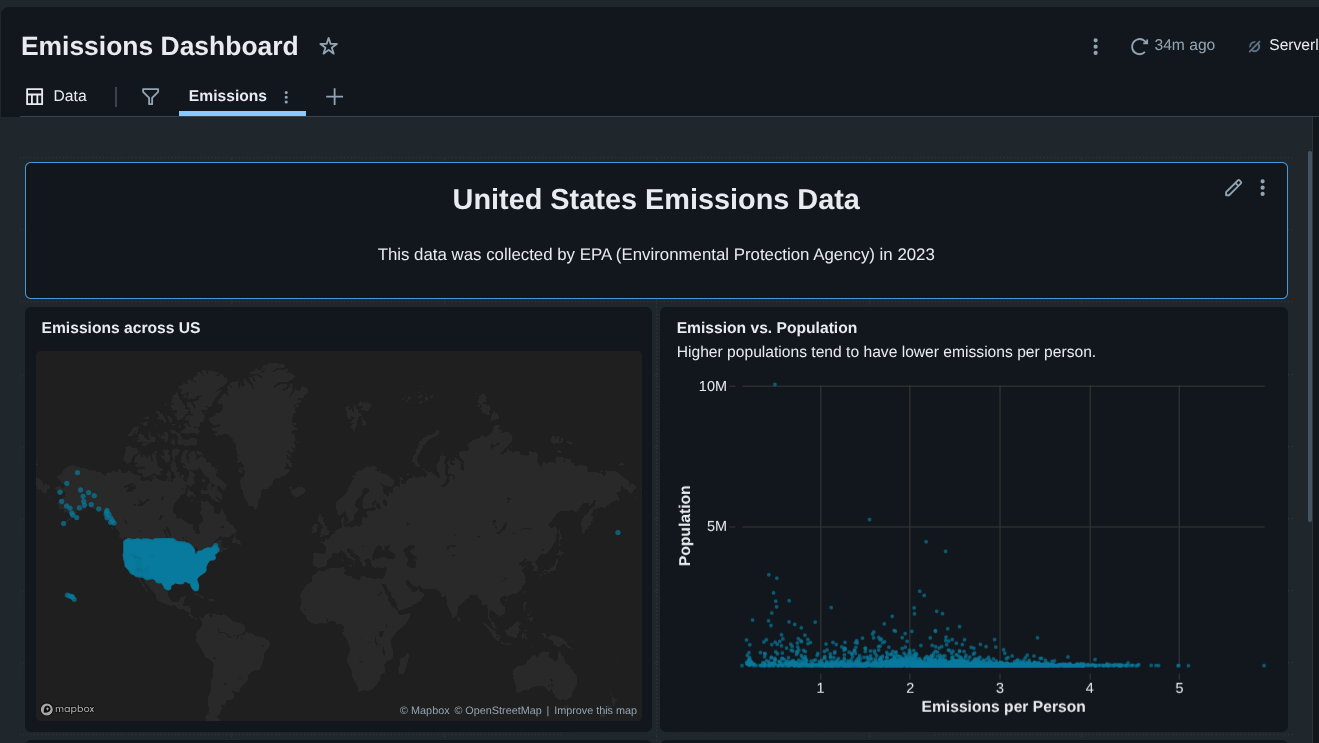
US Emissions Analysis Dashboard using Databricks
Overview
In this project, I built an interactive United States emissions analysis dashboard using Databricks Free Edition.
The goal was to analyze real EPA emissions data and answer practical questions such as:
- Where are emissions geographically concentrated in the U.S.?
- Which states contribute the most to total emissions?
- How do emissions scale with population at the county level?
- Do highly populated areas necessarily emit more per person?
This project covers the full analytics lifecycle:
- Raw data ingestion
- Data cleaning and transformation
- SQL-based analysis
- Dashboard creation and storytelling
Project Architecture
Tech Stack
- Databricks Free Edition
- Databricks SQL
- Built-in Databricks Dashboards
Key Skills Demonstrated
- Working with raw, imperfect data
- SQL aggregations and calculations
- Handling data quality issues (numeric strings, commas)
- Geographic visualization (latitude/longitude)
- Analytical storytelling
Dataset Overview
The dataset contains ~3,000 rows but many columns, including:
- Greenhouse Gas emissions (metric tons of CO2 equivalent)
- Population
- Latitude & Longitude
- County name
- State name and abbreviation
To keep the project focused, I selected only the fields relevant to emissions analysis and geography, rather than attempting to model every variable.
Step 1: Creating a Databricks Catalog and Table
I started by creating a dedicated catalog to keep the project organized.
CREATE CATALOG emissions;Inside the default schema, I uploaded the raw CSV file and created a table named:
emissions.default.emissions_dataDatabricks automatically inferred column types.
At this stage, no transformations were applied — the table represents raw source data, which mirrors real-world analytics workflows.
Step 2: Understanding the Business Problem
The analysis was framed to build a dashboard that answers:
- Where do emissions occur geographically?
- Which regions should be prioritized for intervention?
- How do emissions compare relative to population?
This framing guided every query and visualization decision.
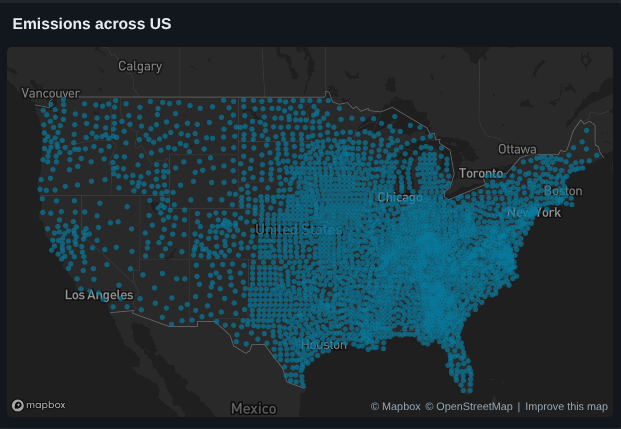
Step 3: Visualizing Emissions by Location (Latitude & Longitude)
The first analysis focused on geographic distribution.
SELECT
	latitude,
	longitude,
	`GHG emissions mtons CO2e`
FROM emissions_data
I visualized the raw coordinates using a point map in Databricks.
Insight
- Emissions cluster heavily in the Mid to Eastern U.S.
- The West Coast, despite high population, shows lower relative emissions
Step 4: Calculating Emissions Per Person (County Level)
This step required data cleaning, because emissions values were stored as strings with commas.
Cleaning and Calculation
SELECT
	county_state_name,
	population,
	TRY_CAST(REPLACE(`GHG emissions mtons CO2e`, ',', '') AS DOUBLE) / NULLIF(CAST(population AS DOUBLE), 0) AS emissions_per_person
FROM emissions_data
ORDER BY emissions_per_person DESC;
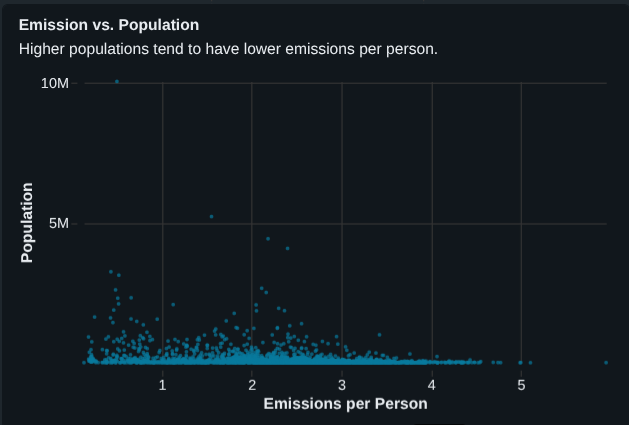
Step 5: Scatter Plot — Emissions vs Population
Using the cleaned data, I created a scatter plot:
- X-axis: Emissions per person
- Y-axis: Population
- Tooltip: county_state_name
Key Findings
- Highly populated counties tend to have lower emissions per person
- Smaller counties often show disproportionately high emissions per person
- Example:
- Los Angeles County ? very high population, low emissions per person
- Small counties in Nelson / Steele ? high emissions per person
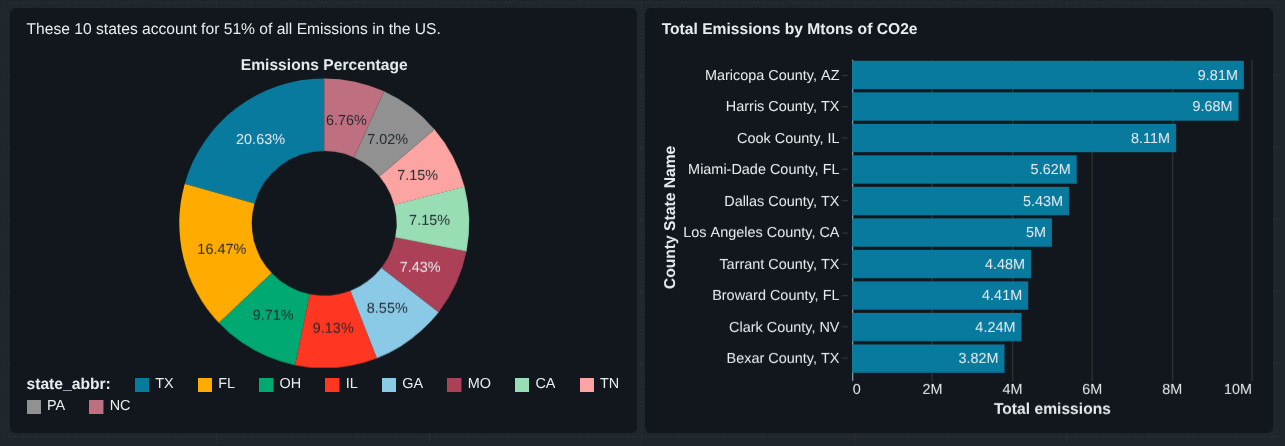
Step 6: Total Emissions by State (Top 10)
Next, I analyzed which states emit the most overall.
SELECT
	state_abbr,
	SUM(TRY_CAST(REPLACE(`GHG emissions mtons CO2e`, ',', '') AS DOUBLE)) AS total_emissions
FROM emissions_data
GROUP BY state_abbr
ORDER BY total_emissions DESC
LIMIT 10;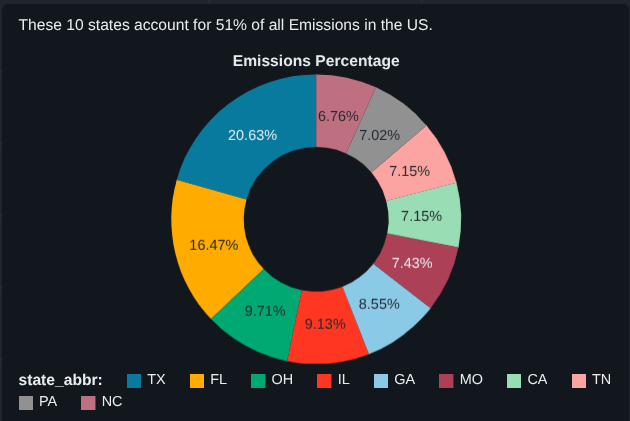
Step 7: How Much Do the Top 10 States Contribute?
To quantify impact, I calculated what percentage of total U.S. emissions comes from the top 10 states.
WITH top10 AS
(
	SELECT
		state_abbr,
		SUM(TRY_CAST(REPLACE(`GHG emissions mtons CO2e`, ',', '') AS DOUBLE)) AS total_emissions
	FROM emissions_data
	GROUP BY state_abbr
	ORDER BY total_emissions DESC
	LIMIT 10
)

SELECT
	SUM(total_emissions) AS top10_emissions,
	(SUM(total_emissions)/
	(SELECT SUM(TRY_CAST(REPLACE(`GHG emissions mtons CO2e`, ',', '') AS DOUBLE)) FROM emissions_data))*100
AS top10_emissions_percentage
FROM top10;
Result
? The top 10 states account for ~51% of total U.S. emissions
This single metric adds strong narrative value to the dashboard.
Step 8: Top 10 Emitting Counties
Finally, I identified counties with the highest absolute emissions.
SELECT
	county_state_name,
	population,
	TRY_CAST(REPLACE(`GHG emissions mtons CO2e`, ',', '') AS DOUBLE) AS total_emissions
FROM emissions_data
ORDER BY total_emissions DESC
LIMIT 10;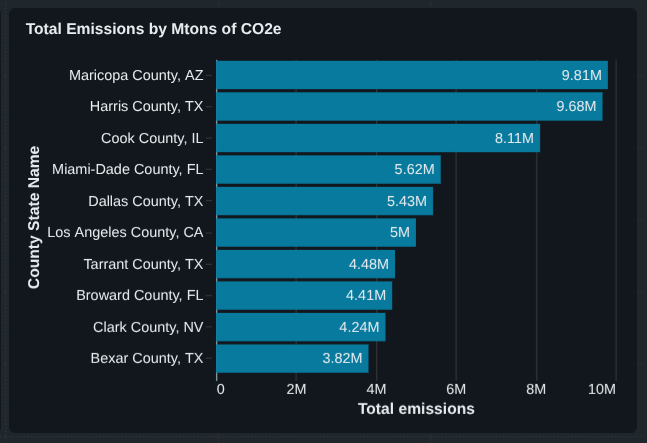
Final Dashboard Components
The completed dashboard includes:
- Emissions map (latitude & longitude)
- Emissions vs population scatter plot
- Top 10 emitting states (percentage)
- Top 10 emitting counties (absolute totals)
- Supporting annotations and insights