CarouselMachine Learning
Master the Confusion Matrix
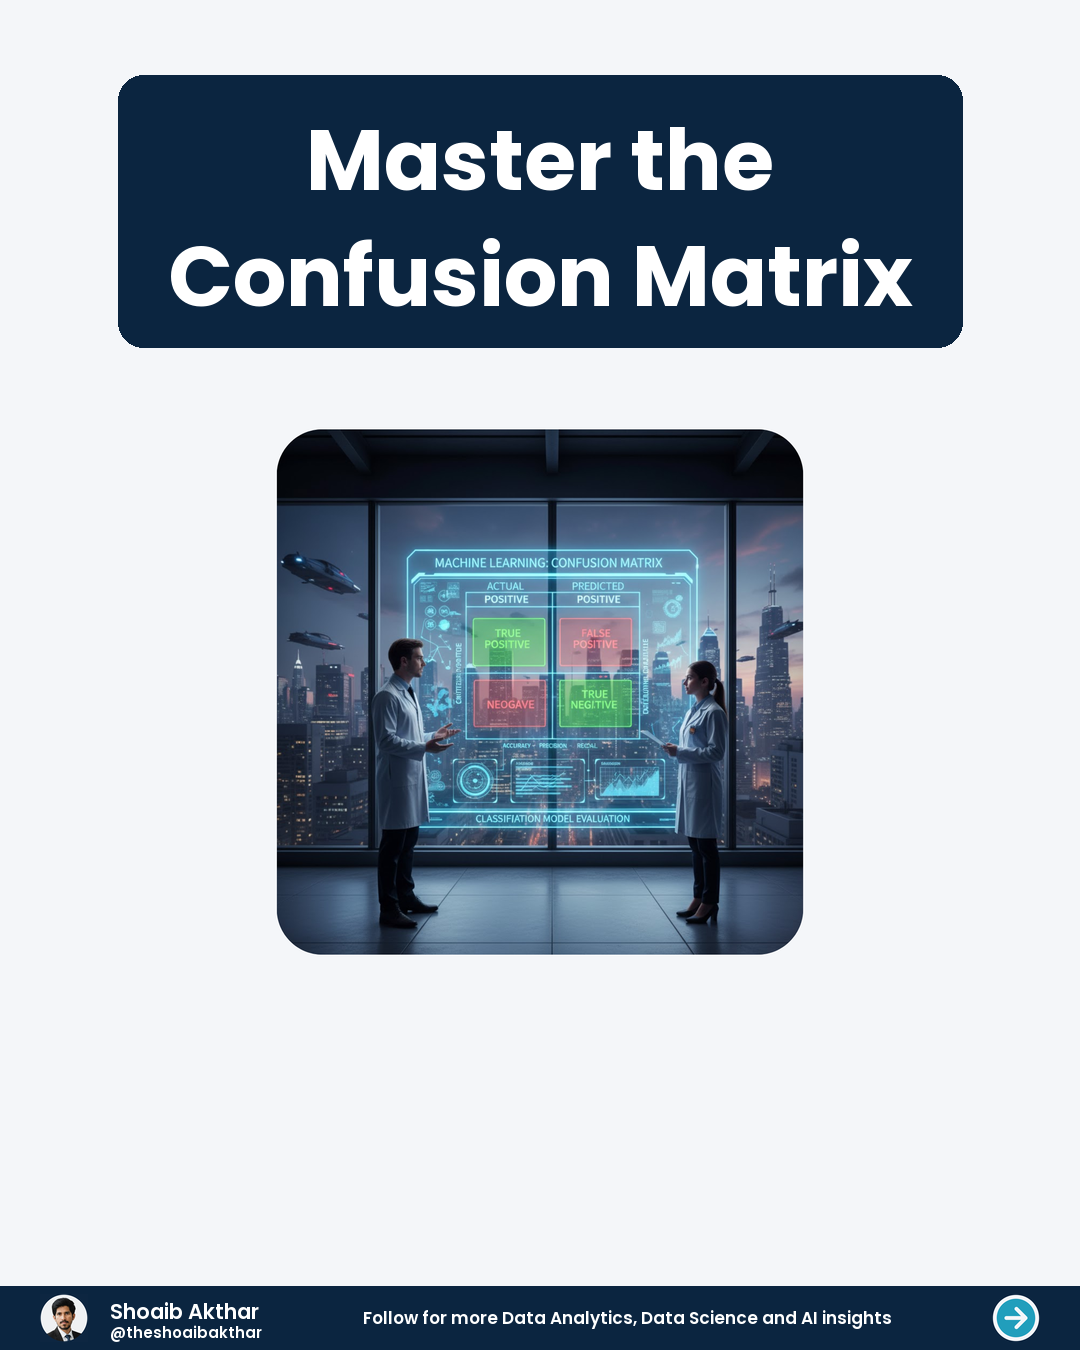
What is a Confusion Matrix? A confusion matrix is a table that helps evaluate the performance of a classification model. It shows how often predictions match actual outcomes. Think of it as a scorecard for your model's accuracy.
 1 / 10
PDF not showing? Open it in a new tab.
Read it as text
The full carousel content, slide by slide.
01What is a Confusion Matrix?
- A confusion matrix is a table that helps evaluate the performance of a classification model. It shows how often predictions match actual outcomes. Think of it as a scorecard for your model's accuracy.
- The matrix has rows for actual classes and columns for predicted classes. Each cell shows the count of predictions for that combination. It's a simple way to visualize model performance.
02Basic Structure Explained
- The confusion matrix has four main components for binary classification. True Positives (TP) are correct positive predictions. True Negatives (TN) are correct negative predictions.
- False Positives (FP) are incorrect positive predictions. False Negatives (FN) are incorrect negative predictions. These terms help assess model accuracy and errors.
03True Positives and Negatives
- True Positives occur when the model correctly predicts the positive class. True Negatives occur when the model correctly predicts the negative class. Both are desired outcomes.
- TP and TN show how well the model identifies correct cases. High values indicate good performance. They are essential for evaluating model reliability.
04False Positives and Negatives
- False Positives occur when the model predicts positive but it's actually negative. False Negatives occur when the model predicts negative but it's actually positive. Both are errors.
- FP and FN highlight where the model makes mistakes. Understanding these helps improve model accuracy. They are crucial for diagnosing model weaknesses.
05Key Metrics Derived
- Accuracy is the ratio of correct predictions (TP + TN) to total predictions. Precision is the ratio of TP to all predicted positives (TP + FP). Recall is the ratio of TP to all actual positives (TP + FN).
- F1 Score combines precision and recall into one metric. These metrics help assess model performance. They provide insights beyond raw counts.
06Why Use a Confusion Matrix?
- It provides a clear view of model performance. It helps identify types of errors the model makes. It's essential for diagnosing and improving models.
- The matrix is simple yet powerful. It's used in various fields like healthcare and finance. It's a fundamental tool in machine learning.
07Example Scenario
- Imagine a spam detector model. TP are correctly identified spam emails. TN are correctly identified non-spam emails. FP are non-spam emails marked as spam.
- FN are spam emails missed by the model. This example shows how the matrix works. It helps understand model behavior in real-world tasks.
08Final Takeaways
- The confusion matrix is a simple yet powerful tool. It helps evaluate and improve classification models. Understanding it is crucial for data scientists.
- Use it to diagnose model errors and track improvements. Mastering the confusion matrix enhances your machine learning skills.