CarouselMachine Learning
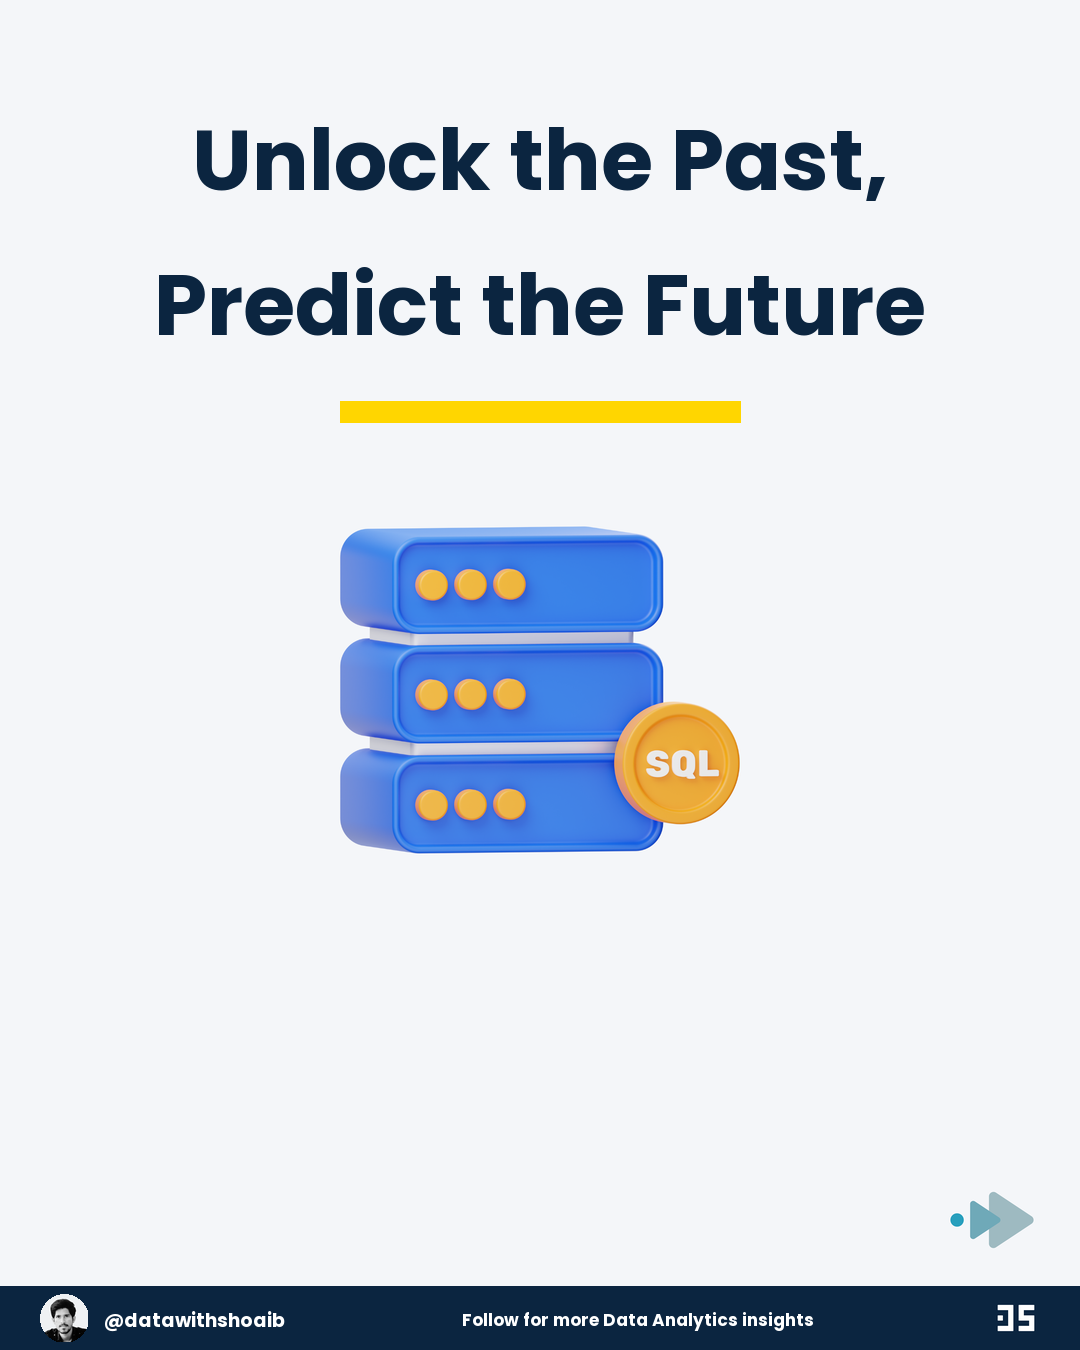
Unlock the Past, Predict the Future
Data points indexed in chronological order Measured at consistent time intervals
 1 / 12
PDF not showing? Open it in a new tab.
Read it as text
The full carousel content, slide by slide.
01What is Time Series?
- Data points indexed in chronological order
- Measured at consistent time intervals
- Examples: stock prices, weather data, website traffic
- Used to analyze trends, cycles, and seasonal patterns
- Goal is often to understand the past and forecast the future
- Found everywhere from finance to IoT sensors
02The Core SQL Toolbox
- SELECT and FROM to retrieve your data
- WHERE to filter specific time periods
- GROUP BY to aggregate over intervals
- ORDER BY to ensure chronological sequence
- Window functions for advanced calculations
- Date and time functions for manipulation
03Filtering Time Ranges
- Use WHERE with date comparisons
- Operators: >, <, >=, <=, BETWEEN
- Filter for a specific year, month, or day
- Use CURRENT_DATE for relative filtering
- Example: WHERE sale_date >= '2023-01-01'
- Isolate data from the last N days
- Exclude public holidays or weekends
04Grouping by Time
- Use GROUP BY with date truncation
- Functions: DATE_TRUNC to standardize intervals
- Aggregate metrics by hour, day, or month
- Calculate sums, averages, counts per period
- Example: GROUP BY DATE_TRUNC('month', timestamp)
- Visualize overall trends over time
- Identify peak and off-peak periods
05Rolling Calculations
- Calculate moving averages to smooth data
- Use window functions like AVG() OVER()
- Define a window frame with ROWS BETWEEN
- Example: 7-day rolling average of sales
- Track momentum and short-term trends
- Reduce noise from daily fluctuations
- Compare current values to recent history
06Period-over-Period Analysis
- Compare performance to a previous period
- Use LAG() to access prior rows
- Calculate week-over-week or year-over-year change
- Compute growth percentage
- Identify if trends are improving or declining
- Example: (current_value / LAG(value) - 1) * 100
- Essential for performance reporting
07Finding Sequential Events
- Use LAG() and LEAD() to navigate rows
- Track user paths or state changes
- Calculate time between two events
- Identify what happens before or after an event
- Example: time from user signup to first purchase
- Detect patterns in event sequences
- Analyze funnel conversion steps
08Ranking with ROW_NUMBER()
- Assign a unique rank to each row within a partition
- Partition data by a category like user_id
- Order by time within each partition
- Find the first or last event in a sequence
- Identify top N records per period
- Useful for session analysis or lead attribution
09Handling Gaps & Imputing
- Time series data often has missing dates
- Use generate_series() to create a complete calendar
- Left join your data to the full date series
- Impute missing values with zero, average, or previous value
- Ensure continuous timelines for accurate calculations
- Critical for consistent aggregation and forecasting
10Real-World Use Cases
-
- Financial: analyzing daily stock returns and volatility
- Marketing: tracking weekly website visitors and conversion rates
- Retail: forecasting daily product sales and inventory needs